
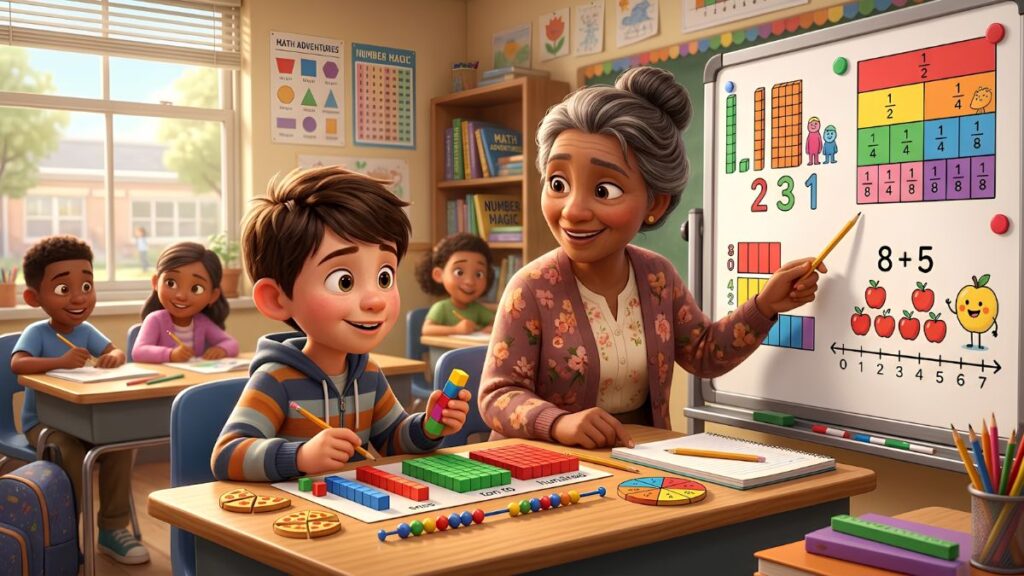
Math can be difficult for students who struggle to understand abstract numbers, symbols, formulas, and multi-step procedures. A student may know how to count objects but have difficulty understanding what an equation represents. Another student may understand addition but become confused when solving a word problem.
Visual math strategies for struggling learners can help bridge this gap by turning abstract mathematical ideas into something students can see, manipulate, organize, and explain.
Visual learning does not mean simply adding colorful pictures to a worksheet. Effective visual strategies show relationships between quantities, steps in a process, patterns, and mathematical structures.
Why Visual Math Strategies Are Helpful
Some learners need more than verbal explanations or written equations to understand a mathematical concept. Visual representations can provide an additional way to process information.
Visual strategies can help students:
- Understand abstract concepts
- Recognize relationships between numbers
- Break complex problems into smaller steps
- Remember mathematical procedures
- Identify patterns
- Organize their calculations
- Understand word problems
- Check whether an answer makes sense
- Explain their reasoning
For example, a student may struggle with:
7 + 5 = 12
but understand the same idea when given seven counters and five additional counters.
The physical objects create a bridge between the real-world quantity and the abstract equation.
Visual Math Strategies for Struggling Learners
Math can feel easier when students can see the ideas they are learning. Discover simple visual math strategies that use drawings, models, number lines, and manipulatives to help struggling learners build understanding and confidence.
Begin With Concrete Objects
For students who are struggling with basic number concepts, start with physical materials before moving directly to drawings or equations.
Useful materials include:
- Counters
- Connecting cubes
- Buttons
- Coins
- Small blocks
- Beads
- Classroom objects
Suppose the problem is:
8 + 4 = ?
Give the student eight counters and four more.
Ask:
“How many counters do you have altogether?”
After the student finds 12, connect the activity to:
8 + 4 = 12
This helps students understand that the symbols represent quantities they can actually see.
Follow the Concrete-Pictorial-Abstract Approach
A useful progression for struggling learners is:
Concrete → Pictorial → Abstract
Concrete
Students use physical objects.
Pictorial
Students draw or use a visual model.
Abstract
Students work with numbers and mathematical symbols.
For example:
- Concrete: 10 counters
- Pictorial: Draw 10 circles
- Abstract: Write the number 10
This progression can help students develop conceptual understanding before relying heavily on memorization.
Use Ten Frames
Ten frames are especially useful in early elementary math.
A student can see how quantities relate to ten rather than counting everything from the beginning.
For example, a frame showing seven counters helps students recognize:
7 = 5 + 2
Ten frames can support:
- Counting
- Number recognition
- Addition
- Subtraction
- Number bonds
- Making ten
- Comparing quantities
They can also help students develop subitizing, which means recognizing small quantities without counting each item individually.
Use Number Lines
Number lines provide a simple visual representation of number relationships.
For: 6 + 4
students can start at 6 and move four spaces forward.
For: 10 – 3
they can start at 10 and move three spaces backward.
Number lines can also support:
- Comparing numbers
- Addition
- Subtraction
- Negative numbers
- Fractions
- Multiples
- Measurement
Encourage students to point to the starting number and physically follow each movement.
Introduce Open Number Lines
Once students understand basic number lines, open number lines can encourage more flexible thinking.
For:
38 + 24
a student might represent the problem as:
38 → 48 → 58 → 62
The student has effectively added 10, then 10, then 4.
This approach encourages mental math and helps students understand that numbers can be broken apart in different ways.
Use Base-Ten Blocks for Place Value
Place value is often difficult when students only see digits.
Base-ten blocks allow students to see the difference between:
- 1 one
- 1 ten
- 1 hundred
- 1 thousand
For example, 326 can be represented as:
3 hundreds + 2 tens + 6 ones
This becomes especially useful when teaching addition and subtraction with regrouping.
Instead of saying:
“Borrow one from the tens place,”
students can physically exchange one ten for ten ones.
This shows what regrouping actually means.
Use Place Value Charts
A place value chart provides another visual support.
| Hundreds | Tens | Ones |
|---|---|---|
| 4 | 3 | 7 |
Students can see that:
437 = 4 hundreds + 3 tens + 7 ones
You can expand the chart for larger numbers:
| Thousands | Hundreds | Tens | Ones |
|---|---|---|---|
| 2 | 4 | 3 | 7 |
This can help students keep digits correctly aligned during calculations.
Use Number Bonds
Number bonds show how a number can be divided into smaller parts.
For example:
       10
      /  \
     6    4
Students can see that:
6 + 4 = 10
They can also use the same relationship to understand:
10 – 6 = 4
Number bonds are particularly useful for developing flexible addition and subtraction strategies.
Use Part-Part-Whole Models
A part-part-whole model helps students see the relationship between parts and a total.
For example:
        15
       /  \
      9    6
This represents:
9 + 6 = 15
It also supports:
15 – 9 = 6
This visual relationship can be particularly helpful when students struggle to determine which operation a word problem requires.
Draw Word Problems
Word problems can be difficult because students must understand the language before solving the mathematics.
Teach students to draw what is happening.
For example:
“There are 6 children on the playground. 4 more children arrive. How many children are there now?”
Students can draw six children and then four additional children.
Then they can write:
6 + 4 = 10
The drawing helps them identify the relationship before choosing the operation.
Use Bar Models
Bar models provide a simple way to represent quantities visually.
For example, if there are 15 total objects and 9 are known:
|--------- 15 ---------|
|---- 9 ----|---- ? ----|
Students can see that the missing part is:
15 – 9 = 6
Bar models can also be used for:
- Addition
- Subtraction
- Multiplication
- Division
- Fractions
- Ratios
- Word problems
Use Arrays to Teach Multiplication
Instead of teaching multiplication only as memorized facts, show equal groups visually.
For: 4 × 3
draw:
● ● ●
● ● ●
● ● ●
● ● ●
Students can see four groups of three.
Then connect the visual to:
4 × 3 = 12
Arrays also help students understand:
3 × 4 = 12
because rotating the array does not change the total number of objects.
Use Equal Groups for Division
Division can also be represented visually.
For: 12 ÷ 3
give the student 12 counters.
Ask them to divide the counters equally into three groups.
Each group receives four.
The student can then see:
12 ÷ 3 = 4
This approach helps explain the meaning of division before introducing more complicated algorithms.
Use Fraction Strips
Fractions become easier to understand when students can compare actual sections of the same whole.
For example:
1/2
can be shown as one of two equal sections.
1/4
can be shown as one of four equal sections.
Students can visually see that:
1/2 > 1/4
even though the denominator of 4 is larger.
This helps correct a common misunderstanding where students assume that a larger denominator means a larger fraction.
Use Fraction Circles
Fraction circles provide another useful representation.
Students can compare:
- Whole
- Halves
- Thirds
- Fourths
- Eighths
They can physically place pieces together to explore equivalent fractions.
For example:
1/2 = 2/4 = 4/8
The visual model shows that these fractions represent the same amount.
Use Area Models
Area models are useful for multiplication and fractions.
For example, a rectangle can represent:
23 × 4
Break 23 into:
20 + 3
Then represent:
20 × 4 = 80
and:
3 × 4 = 12
Finally:
80 + 12 = 92
This helps students understand why the distributive property works.
Use Color Coding Carefully
Color coding can help students organize information, particularly in multi-step calculations.
For example:
- Circle important numbers.
- Underline the question.
- Box the operation.
- Highlight the final answer.
The exact colors are less important than consistency.
If the same visual system is used regularly, students can learn what each marking means.
Avoid using too many colors because excessive visual information can become distracting.
Break Multi-Step Problems Into Boxes
A student who struggles with long problems may benefit from seeing one step at a time.
For example:
- Step 1: What do I know?
- Step 2: What do I need to find?
- Step 3: What strategy should I use?
- Step 4: Solve.
- Step 5: Check.
This structure reduces the amount of information students must process at once.
Use Visual Checklists
For procedures such as long division, students can use a visual checklist:
☐ Divide
☐ Multiply
☐ Subtract
☐ Bring down
☐ Repeat
Students can check each step as they complete it.
This can reduce errors caused by forgetting a step rather than misunderstanding the mathematics.
Use Graphs and Tables
Graphs turn numerical information into visual information.
Use:
- Bar graphs
- Picture graphs
- Line plots
- Tables
- Charts
Ask questions such as:
- Which category has the most?
- Which has the least?
- How many more?
- What is the difference?
This helps students connect numbers with visual patterns.
Use Visual Timelines for Time
Time can be challenging because students must understand both numbers and intervals.
A timeline can help.
For example:
2:15 → 2:30 → 2:45 → 3:00
Students can see the 15-minute intervals.
Timelines can help with:
- Elapsed time
- Scheduling
- Duration
- Sequencing events
Use Money as a Visual Model
Money provides a practical context for mathematical operations.
Students can use play coins or drawings to solve problems.
For example:
$5.00 – $2.35
Students can physically represent the amount before working with decimal notation.
Money activities can reinforce:
- Addition
- Subtraction
- Decimals
- Place value
- Estimation
Use Real-Life Visual Examples
Connect mathematical ideas to situations students recognize.
- Fractions: Use slices of food or divided objects.
- Measurement: Measure classroom objects.
- Geometry: Identify shapes in buildings and classroom materials.
- Money: Use shopping examples.
- Time: Use classroom schedules.
- Graphs: Graph favorite books, fruits, sports, or classroom preferences.
The more meaningful the context, the easier it may be for students to connect the visual representation to the mathematical concept.
Let Students Build Their Own Models
Teachers do not always need to provide the visual.
Ask students:
“Show me how you solved this.”
They might:
- Draw a picture
- Build an array
- Use a number line
- Make a bar model
- Create a number bond
Allowing students to choose their representation can reveal how they understand the problem.
Encourage Multiple Representations
Show students that the same problem can be represented in several ways.
For: 8 + 7
a student might use:
- Counters
- Ten frame
- Number line
- Number bond
- Drawing
- Equation
The goal is to help students understand that these are different representations of the same mathematical relationship.
Ask Students to Explain the Visual
Simply drawing a model does not guarantee understanding.
Ask:
- “What does this picture show?”
- “Why did you draw it this way?”
- “Where can you see the answer?”
- “How does your model match the equation?”
These questions encourage mathematical communication and reasoning.
Use Graph Paper for Organization
Graph paper can be especially helpful for students who have difficulty keeping numbers aligned.
It can support:
- Multi-digit addition
- Subtraction
- Multiplication
- Division
- Fractions
- Coordinate grids
Students can place one digit in each square.
This reduces alignment errors and makes calculations easier to organize.
Use Visual Supports for Geometry
Students who struggle with geometry can benefit from physical and visual models.
Use:
- Shape cards
- Pattern blocks
- Geometric drawings
- Tangrams
- Geoboards
- Folded paper
Ask students to identify:
- Sides
- Vertices
- Angles
- Symmetry
- Similarities
- Differences
Use Anchor Charts
Keep important strategies visible in the classroom.
For example:
Addition Strategies
- Count on
- Make ten
- Break apart numbers
- Use a number line
Another chart could show:
Fraction Vocabulary
- Numerator = top number
- Denominator = bottom number
- Equal parts = parts of the same whole
The charts should be concise and easy for students to reference independently.
Create Visual Math Vocabulary Cards
Some struggling learners may understand the mathematics but struggle with mathematical vocabulary.
Create cards for terms such as:
- Greater than
- Less than
- Equal
- Sum
- Difference
- Product
- Factor
- Fraction
Include:
- The word
- A simple definition
- A symbol
- A visual example
This can help students connect mathematical language with concepts.
Use Hands-On and Visual Learning Together
Students do not have to choose between manipulatives and drawings.
For example:
First
Build 3 groups of 4 counters.
Next
Draw 3 groups of 4.
Finally
Write:
3 × 4 = 12
This sequence reinforces the same concept through multiple representations.
Gradually Remove the Visual Support
Visual supports should help students become more independent.
A useful progression is:
- Teacher Modeling: The teacher provides the visual.
- Guided Practice: Teacher and student create it together.
- Independent Practice: Student creates the visual.
- Reduced Support: Student determines whether a visual is needed.
Eventually, students should be able to solve many familiar problems without relying on a model every time.
Use Visual Strategies During Small-Group Instruction
Small-group instruction provides an excellent opportunity to use manipulatives and visual models.
A small group might work on:
- Monday: Number lines
- Tuesday: Ten frames
- Wednesday: Number bonds
- Thursday: Word-problem drawings
- Friday: Mixed strategy practice
The teacher can observe which representation helps each student most effectively.
Keep Visual Materials Simple
Avoid overwhelming students with too much information.
A worksheet containing multiple fonts, decorative graphics, complicated diagrams, and several unrelated examples can make it harder to focus.
Instead:
- Use clear diagrams.
- Leave enough white space.
- Show one process at a time.
- Keep labels simple.
- Remove unnecessary decoration.
The purpose of the visual is to clarify the mathematics.
Check Whether the Strategy Is Working
A visual strategy is useful when it helps students become more accurate and independent.
Look for signs such as:
- The student can explain the concept.
- Errors decrease.
- The student chooses an appropriate strategy.
- The student can connect the visual to the equation.
- The student can solve a similar problem independently.
- The student needs fewer prompts over time.
If the visual creates confusion, simplify it or try a different representation.
A Simple Visual Math Routine
Teachers can use the same routine whenever students encounter a difficult problem.
Step 1: Read
Read the problem carefully.
Step 2: Identify
Determine what information is important.
Step 3: Show
Create a drawing, model, number line, or diagram.
Step 4: Solve
Use an appropriate mathematical strategy.
Step 5: Check
Look at the visual and decide whether the answer makes sense.
Step 6: Explain
Explain the solution using words, numbers, or pictures.
This routine helps students understand that solving mathematics involves more than memorizing procedures.
Visual Math Toolkit for the Classroom
A small collection of reusable materials can support many concepts.
Consider keeping:
- Counters
- Connecting cubes
- Ten frames
- Number lines
- Base-ten blocks
- Place value charts
- Number bonds
- Fraction strips
- Fraction circles
- Graph paper
- Rulers
- Play money
- Pattern blocks
- Multiplication charts
- Math graphic organizers
These materials can be used repeatedly across different lessons.
Common Mistakes to Avoid
- Using Pictures Just for Decoration: Every visual should have a mathematical purpose.
- Providing Too Much Information: Too many visual elements can overwhelm struggling learners.
- Using Different Systems Every Lesson: Consistent visual routines are easier to learn.
- Relying Only on Manipulatives: Students should eventually connect objects to drawings and mathematical symbols.
- Removing Support Too Quickly: Give students enough time to understand the representation.
- Keeping Support Forever: Gradually encourage students to choose and use strategies independently.
Example: Teaching a Difficult Word Problem Visually
Consider:
“A classroom has 18 pencils. The teacher gives students 7 more. How many pencils are there now?”
Step 1: Identify the quantities
18 and 7
Step 2: Draw a model
|--------- 18 ---------|---- 7 ----|Step 3: Choose the operation
The amount is increasing, so use addition.
Step 4: Solve
18 + 7 = 25
Step 5: Check
The answer should be greater than 18 because seven pencils were added.
This example shows how visual representation can support both computation and reasoning.
Final Thoughts
Visual math strategies for struggling learners can make mathematics more understandable by giving students another way to see and organize mathematical information. Tools such as ten frames, number lines, base-ten blocks, number bonds, bar models, arrays, fraction strips, place value charts, graphs, drawings, and graphic organizers can support a wide range of concepts.
The most effective approach is to move from concrete materials to visual models and eventually to abstract mathematical notation. Students should have opportunities to build models, draw representations, explain their thinking, and eventually decide which strategy is most useful for a particular problem.
Visual strategies should also be used consistently and purposefully. A simple number line that clearly demonstrates addition is more valuable than a worksheet filled with distracting graphics.
With regular practice, visual math strategies can help struggling learners develop stronger number sense, problem-solving skills, mathematical vocabulary, confidence, and independence.
